
In recent years, the eCommerce market in Romania has started to grow significantly.
How do we know?
From our own experience.
From the final quarter of 2019 through the end of the first quarter of 2020, we tested a series of campaigns for clients operating in different eCommerce categories.
We concluded that the market was continuing to grow, although it had not yet reached the level seen in Western Europe.
Romanian and European eCommerce statistics
Let us set the rest of Europe aside for a moment.
We will focus instead on Romania and the considerable potential of its online market.
By the summer of 2019, around 26% of people in Romania were shopping online. Following the events of early 2020, that rate began to rise rapidly.
How far could it grow?
At the time, our view was that it could increase by at least 60% from that point once the immediate disruption ended. We believed the crisis would encourage more consumers to learn how to buy online and discover how easily the entire purchasing process could be completed.
People were often sceptical about online shopping because of trust, delivery speed and payment security. These concerns could be addressed through good marketing, a stronger customer relationship and greater online authority.
Looking at Eastern European countries, approximately 72% of the population had internet access and 50% of those users went online to shop.
In 2018, 20% of the population shopped online, while 2019 recorded an increase of roughly 2–5%.
What happened in 2020?
During 2020, percentages began to rise across many sectors and more people gained confidence in buying products online.
Statistics also suggested that 48% of people wanted to see a product before buying it, while cash on delivery remained the preferred payment method for 70% of buyers.
Devices used for online sales
By the end of 2019, statistical reports on devices used for online shopping showed the following:
Sales by device: 36.4% desktop or laptop and 63.6% mobile.
Sales value by device: 42.9% desktop or laptop and 57.1% mobile.
Average order value by device: RON 289 on desktop or laptop and RON 205 on mobile.
Share of clicks by device: 28.1% desktop or laptop and 71.9% mobile.
Conversion rate by device: 2.10% desktop or laptop and 1.43% mobile.
Clicks and sales by time of day
The highest level of mobile activity was recorded between 20:00 and 00:00. This interval generated 29% of traffic and 26% of sales.
The statistics also indicated that people were generally active on desktop and laptop devices between 10:00 and 14:00. Those devices generated 27% of traffic and 30% of sales during that period.
During the day, the conversion rate was statistically better on desktop and laptop than on mobile. The largest share of sales was recorded between 22:00 and 23:00, representing 4.6% of all sales.
How Romania's online market evolved
To make the subject easier to follow, we divided it into several observations:
1. The rate of online product purchases had increased significantly in recent years.
2. Half of Romania's online stores had been launched during the previous five years.
3. The number of online stores continued to rise, especially during the crisis.
4. More than 40% of urban buyers said they were shopping online more often and placing an order at least once a month.
5. Approximately 40% of online purchases were made on mobile devices.
6. Cash on delivery was still the preferred payment method.
7. A popular approach to generating online sales combined long-term SEO, high-quality video, photography and written content, and both short- and long-term advertising.
8. IT products, electronics and household appliances were among the categories selling most online at the time.
Two Romanian online-store case studies from 1 September 2019 to 31 March 2020
Online clothing store
The first subject in our case study was an online clothing store with accessible prices and a strong quality-to-price ratio for the general consumer.
The promotional campaign began with advertising and photo-and-copy content for Facebook and Instagram. This first stage allowed us to study the audience's organic response to posts. The client had more than 5,000 followers across Facebook and Instagram.
Unfortunately, organic response was fairly weak after Facebook updated its algorithm and reduced the priority given to business pages in users' news feeds.
What came next?
At the beginning of December, we launched paid campaigns on Facebook and Instagram with a monthly advertising budget of RON 5,000. Because courier companies stopped operating over part of the holiday period, sales remained healthy until 18 December.
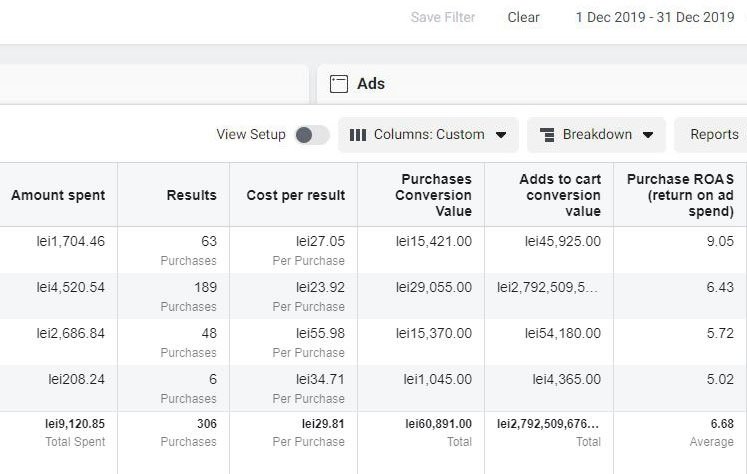
At our suggestion, the client reduced prices throughout the Christmas period. By the end of the month, the store had generated approximately RON 33,000 in sales from RON 5,000 in advertising spend, producing a reported ROAS above 6.5.
How did we continue in January?
In January, we decided to adopt a different strategy because campaign performance had begun to decline.
We focused on high-quality video content produced by our photo and video team and adjusted the online advertising budget.
For the following period, we chose a monthly budget of approximately RON 3,000 to test and scale new campaigns using the information gathered to date.
As the report above indicated, campaign performance improved and the reported profit began to increase.
After subtracting product, delivery and advertising costs in the calculation used at the time, the client recorded RON 20,000 in company profit.
Online grocery store
The second subject in our case study was an online grocery store.
What was the business's position in the market?
1. The store had only recently been established.
2. It had conducted no online marketing.
3. It had not invested in SEO.
4. It carried a limited number of products.
5. It delivered throughout Romania.
What promotional strategy did we use?
Starting in January with an online advertising budget of RON 2,000, we focused on different promotions and testing campaigns.
By observing developments in the global market, we anticipated the period in which people would remain at home and implemented the strategy using the information available to us.
With more than three years of experience in the field and more than one million dollars spent on online advertising campaigns globally at that time, we chose an aggressive content strategy.
We used methods including SEO, chatbots and email marketing, as well as LinkedIn and paid campaigns on Google, Facebook, Instagram and Messenger, to support the store's promotional activity.
How did the campaign begin?
We started by warming cold audiences.
This helped us discover how to deliver information to people while using the advertising budget as efficiently as possible.
Advertising offered a fast way to begin the campaign because SEO required more time to gain visibility in Google and other search engines.
After one month of work and data collection, we gradually launched more sales campaigns.
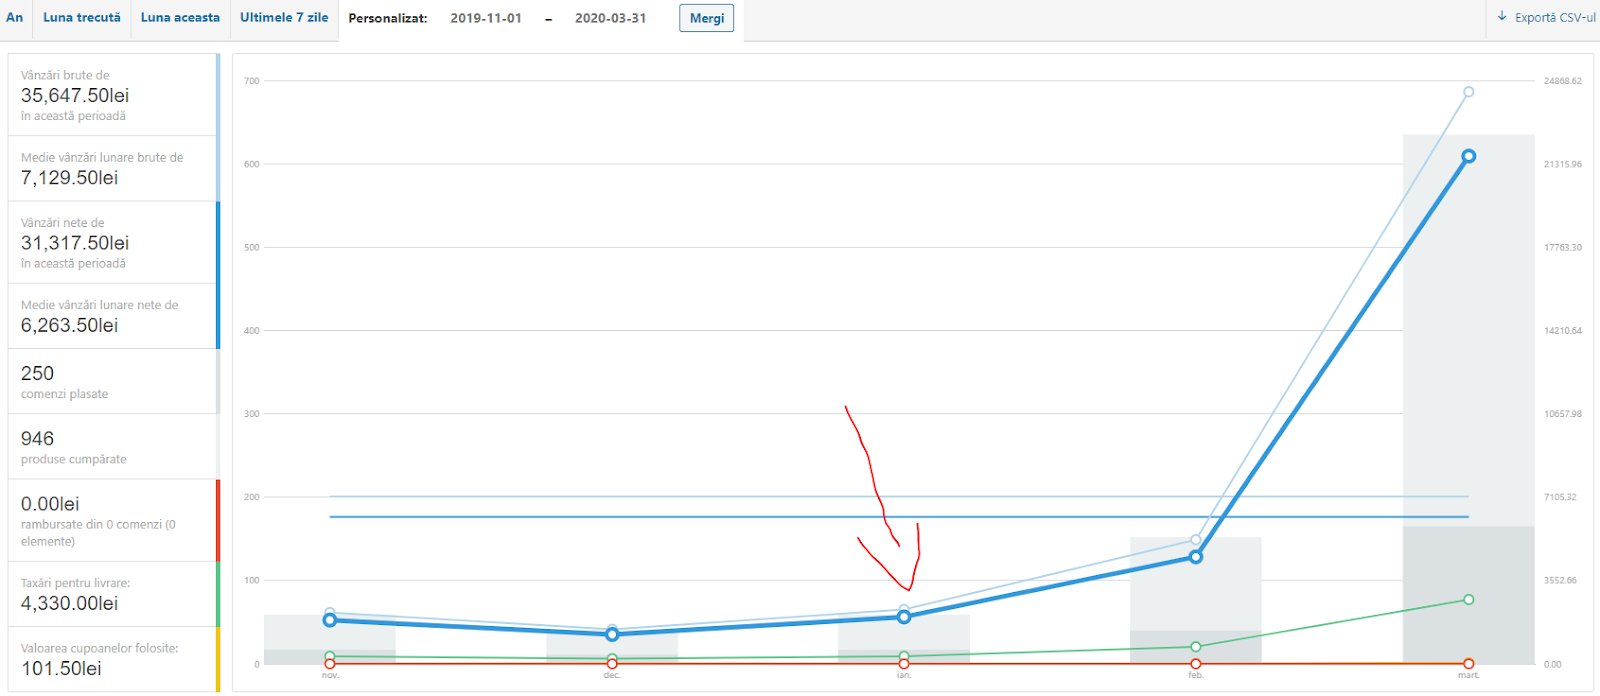
January produced approximately RON 2,000 in sales and the store recorded a small loss.
The general profit margin on a product was approximately 30–50% of its total value. Our calculation used the lower percentage to account for risk.
Returning to the results, although January sales were only RON 2,000 and the store was not yet profitable, we collected substantial audience information and gained a clearer view of where potential customers could be targeted.
In a summary calculation, the store generated approximately RON 600 in profit from sales. After subtracting the RON 2,000 paid to advertising platforms, January ended with a loss of approximately RON 1,400.
How did the campaign continue in February?
In February, sales exceeded RON 3,700 and product profit was estimated at approximately RON 900.
After subtracting advertising costs, the month ended RON 1,100 down. Adding the RON 1,400 from January produced a cumulative shortfall of RON 2,500.
What happened in March?
March was the month in which the earlier work began to produce results.
Amid the disruption caused by the coronavirus, many people began shopping online, and the same behaviour was visible in Romania.
Using the data collected in previous months, we generated more than RON 22,000 in sales by the end of March while keeping the advertising budget unchanged.
What was the advantage?
The previous campaigns had produced enough data to create warmer, more productive audiences.
At the end of March, the calculation used in the case study was:
Sales: RON 22,000.
Advertising investment: RON 2,000 plus the RON 2,500 shortfall accumulated in previous months.
Product profit before advertising investment: RON 6,600.
Reported net profit: RON 2,100.
Conclusion
If you were planning to open an online store or move your business online, the article's recommendation at the time was to act.
It also argued that a new idea backed by investment could use the circumstances to its advantage.
The original conclusion was that knowing the potential of the business and working with experienced online specialists substantially improved the prospects of selling products or services online.
It nevertheless highlighted two requirements: patience and persistence.
When you decide to develop your business online, Business Simplify is ready to help.